Dive Brief:
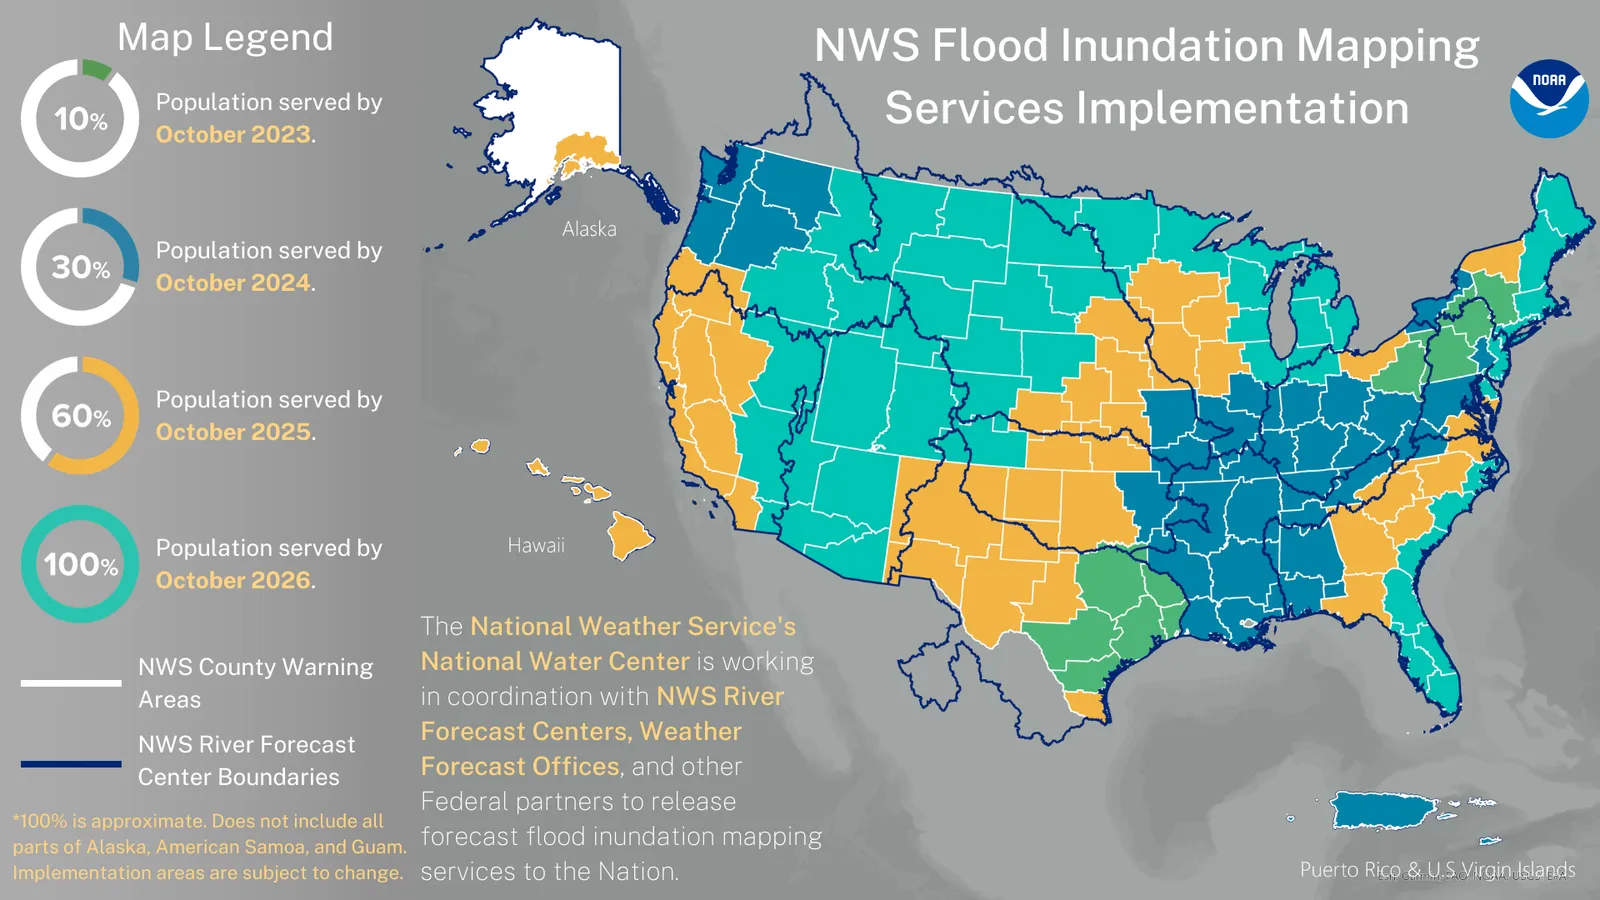
- The National Weather Service last week launched a four-year nationwide rollout of “experimental” flood forecasting maps. The maps show when, where and how much floodwaters are expected to impact specific areas up to five days in advance.
- The flood inundation maps now cover eastern Texas, central Pennsylvania and parts of the Northeast. The service plans to expand across more communities each year until 2026 when the maps will cover 100% of the population.
- With this information added to existing tools, emergency managers will be able to see where a flood’s forecast “footprint” overlaps with built infrastructure, including that serving vulnerable communities, said David Vallee, director of the Service Innovation and Partnership Division of the Office of Water Prediction, which is part of the National Water Center. The emergency management community has been asking for such tools for over a decade, he noted.
Dive Insight:
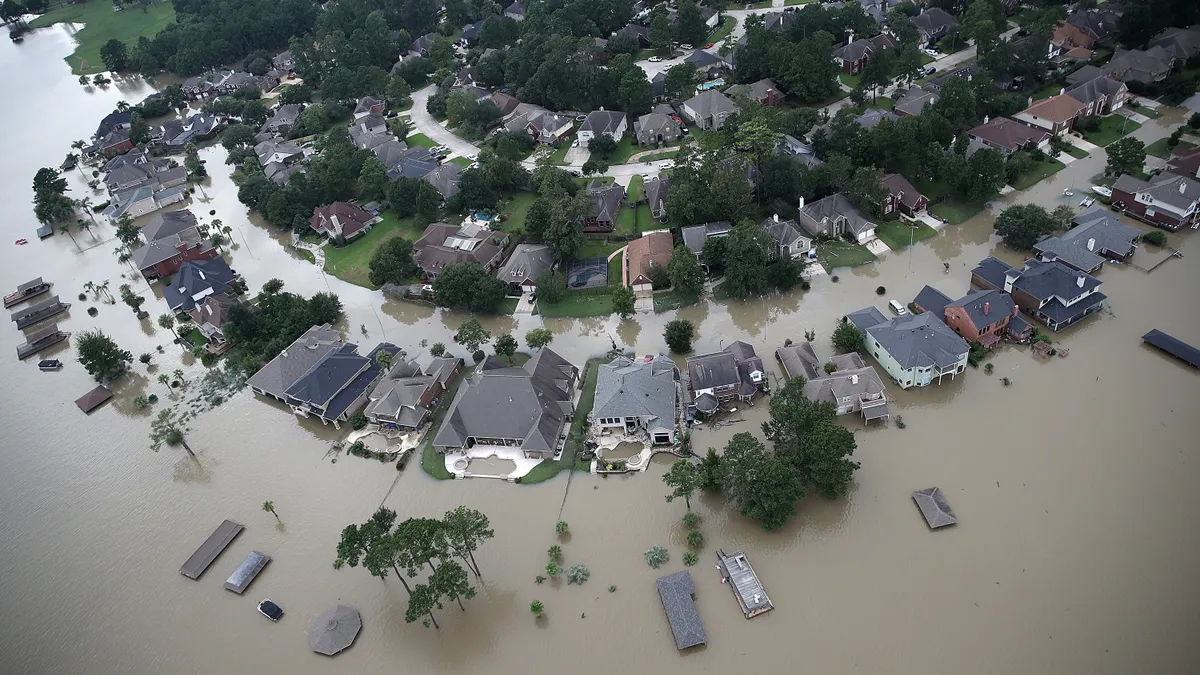
In the U.S., floods happen more than any other severe weather-related threat and cost more than any other natural disaster.
Up until now, the National Weather Service has only been able to tell communities that they are under a flood watch or warning rather than share detailed information about exactly what that could look like on the ground, Vallee said. The maps released last week changed that.
“You can type in your address, zoom into your neighborhood and see, ‘Am I at risk? Is this prediction, based on their forecast, suggesting that my house may be in the flooded area? Am I going to lose access to the roads in my community during the flooding?’” he said.
Emergency managers can integrate the mapping services into their own geographic information system architecture and see the flood’s potential impact on specific community features, Vallee said. That includes “where the nursing homes are, the assisted living facilities, the roadways, the bridges, the bus stops, the schools,” he said.
Although the official rollout of the maps just began, Vallee said emergency managers have already told him they may be game-changing in terms of flood preparation. During a 2021 “tabletop exercise,” Vallee’s team simulated for New York state officials what it would have been like if they had had access to the flood mapping services during 2011’s destructive Hurricane Irene. One emergency manager told him that if the maps had been available during that storm, officials would have established a larger evacuation area earlier, moved emergency assets out of the flood zone, pre-positioned resources and been able to provide better information to residents hit the hardest, Vallee said.
Vallee reports that emergency managers have also said they would use the tool four and five days out from a flood event to spin up situational awareness and again within the 72-hour window before an expected flood to make “core decisions” to protect life and property.
The maps have some limits, however. They can’t yet forecast the urban flash floods caused by intense rainfall on pavement and overwhelmed stormwater systems, rather than by rivers and streams, Vallee said. “That’s at the very edge of our scientific limits,” he said, but the team is working on it.
Coastal areas also pose challenges, Vallee said. They can have very dense populations, and models require consideration of numerous complex factors including ocean storm surges. That’s why many of these areas will be among the last batch to gain access to the maps in 2026, allowing for time to develop the modeling capability, Vallee said.
“There are a lot of lives at risk,” he said. “The last thing we want to do is confuse our emergency managers.”
The National Water Center is running a training program to teach local weather office forecasters how to use the tools, with the goal of having them train staff and partners in their communities, Vallee said.


