Dive Brief:
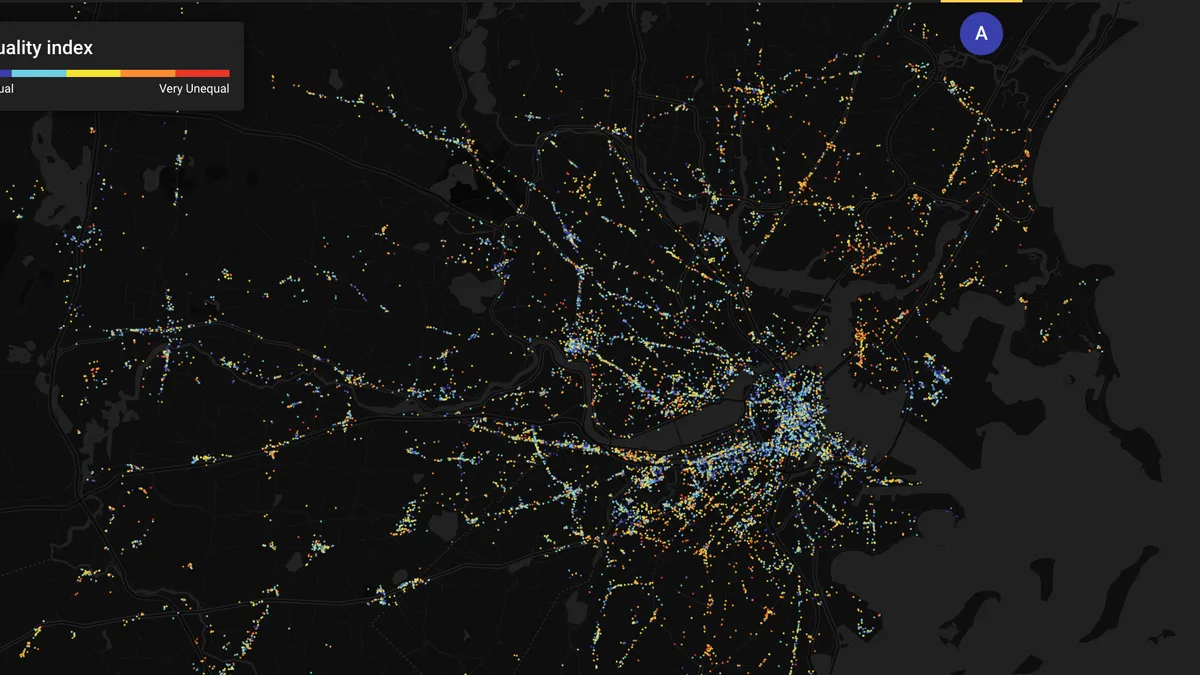
- Researchers at the Massachusetts Institute of Technology (MIT) have created the Atlas of Inequality, which shows income inequality among people who visit different places throughout the Boston area. It's part of a larger initiative to understand how human behavior and large scale problems like transportation, housing, segregation and inequality in urban areas depend, in part, on the patterns of people's individual opportunities and choices.
- The interactive map shows the places people visit most — including restaurants, coffee shops, movie theaters and stores — using anonymized, aggregated location data. It shows the socioeconomic backgrounds of people who visit each location, how similar the incomes of all visitors are and how much time they spend at the location. More blue dots on the map indicate greater diversity, meaning more people from all income groups visit the location. More red dots indicate greater inequality, meaning the location is more segregated by income group.
- Billions of data points were gathered from about 150,000 users by Cuebiq's location intelligence (provided through their Data for Good initiative) from October 2016 to March 2017. They were analyzed along with census information to determine user income groups and visitation patterns. Researchers used the Foursquare API to identify 30,000 places people visit. Users had to stop at a place for more than five minutes for it to count.
Dive Insight:
The researchers discovered that commonly visited places, like coffee shops, can be within a few feet of each other but they can each primarily have visitors from completely different income brackets. This indicates that economic inequality isn't just present at the neighborhood level, but it can also show up among the places people visit as part of their daily routines. It suggests that income inequality might impact not just where people live, but also where they go.
There were a few limitations to the study that make the researchers note their results could be incomplete. First, the locations were limited to those available via the Foursquare API. Second, the methodology does not account for GPS noise, so some user visit data could be wrong. And third, users were selected based on having consistent home locations during the six-month study period, which eliminates smartphone users who are homeless, in transition or work shifts between 8 p.m and 4 a.m. Still, the map is believed to be largely representative of the Boston area's location-based income inequality.
The map documents income inequality, not class inequality, even though the two are commonly intertwined in colloquial terms. Boston's struggle with income inequality is well documented, including by The Boston Globe, which explains that the surge in wealth in some areas and poverty in others several decades ago has eliminated many mixed-income neighborhoods.
Earlier this year, Boston Mayor Marty Walsh announced a comprehensive legislative package to address housing security and economic mobility. The goal of the 14-bill package is to promote equity, opportunity and resilience, and to provide greater housing protections for low-income residents. Walsh reportedly plans to send three other similar bills to the state legislature this year.
Last year the city partnered with 100 Resilient Cities to host a three-day gathering of chief resilience officers and other officials from eight cities to address another issue related to inequality: racial disparity and systemic inequality. They discussed how local leaders can promote more equitable delivery of core services — such as housing and transportation — to all residents.
The Atlas of Inequality has the potential to help city leaders identify areas of inequality at a micro level that could be targeted for improvements. For example, it could assist with better determining where low-income residents visit and why. The "why" is a big part of improving service distribution, as discovered in Chicago when analyzing bike-share programs. A study by researchers at Northwestern University found that residents in low-income neighborhoods don't take to some city services such as bike-share at the same rate as those in high-income neighborhoods because they're skeptical of gentrification and believe other service improvements are more pressing.


