Flood-risk data can carry a lot of power in U.S. communities. Information on which areas are most in danger of flooding may guide local decisions such as where to avoid development and where to make flood-mitigation investments. But what if the data guiding these choices is wrong?
That’s a question at the heart of a July paper published by researchers at the University of California, Irvine, and the University of Miami. The researchers warn that data from national flood-risk models may be inaccurate at the local level in cities, possibly leading to inappropriate countermeasures in the face of climate change.
“If you're a regional flood manager and you're thinking about what the highest priority project [is], the shifts in the data product could shift where the budget goes,” said Brett Sanders, an author of the paper and a chancellor’s professor of civil and environmental engineering, urban planning and public policy at UC Irvine.
Sanders and his team reached their conclusion by comparing two flood-risk models for Los Angeles County: One from First Street, a major player in the climate risk data space, and one the researchers developed themselves. The models resulted in hazard maps with different “bull’s-eyes” showing which areas are most at risk of inundation during both a 100-year flood and a 20-year flood, Sanders explained. He specifically noted that his team’s model predicts a larger flood zone in disadvantaged communities along the Los Angeles River.
Although the researchers admit in the paper that they’re not sure which model is more accurate, they make the case for their model because it uses methods known to increase the accuracy of urban flood-risk predictions. It includes fine-resolution data on the area’s topography, for example, as well as details on culverts, underground pipes and street drains.
“A lot of times, the national data sets are just a little too crude,” Sanders said. “They're not refined enough to depict all of the features that affect flooding, like all the levees, the pump stations, the culverts.”
First Street representatives say the researchers’ model isn’t necessarily more accurate, it’s just different, as many models are. “If we were to throw in a third model, I expect that the third model would be different” from the other two, said Jeremy Porter, First Street’s head of climate implications research. First Street’s information is used in many applications, including for public awareness efforts, federal mapping tools, state buyout programs, insurance pricing and scientific research, according to the researchers’ paper.
“We don't want our models to be seen as inferior to other models,” Porter said. “We spend a lot of time going through the peer-review process, publishing high-quality data, specifically for the purpose of being able to prove out the models. That being said, it is a model, and it's being compared to another model.”
Porter added that the researchers looked at a several-year-old version of First Street’s model, which may be slightly — although “not terribly” — different from the organization’s current model.
Measuring a model’s accuracy
It’s not easy to prove which model is more accurate for a specific community. Ideally, researchers could compare the predictions against what plays out during a real-world extreme flood event, Sanders said. “That type of data only comes along when you have … a really severe extreme event, like your [Hurricane] Katrinas,” he said. “We haven't had that kind of big event in Los Angeles for a really long time.”
In theory, the factors the researchers accounted for in their model should make it more locally accurate in a city, said Antonia Sebastian, an assistant professor in the environmental sciences and engineering department at the University of North Carolina at Chapel Hill who was not involved in the research.
First Street compared the two models’ flood zone predictions against data on historic Federal Emergency Management Agency claims, both for the National Flood Insurance Program and Individual Assistance Program, which Porter said tends to be used more for renters and people who don’t own their homes or have flood insurance. It found that its model aligns slightly better with the claims data it looked at for the city of Los Angeles, Porter said.
Porter said that since the FEMA claims data only goes back roughly 40 years, "you wouldn’t expect the correlation to be really high with any of the models" showing a 100-year flood zone. “But the fact that they were pretty similar to one another, I think, indicates that the models, in general, are picking up risk in areas where we see historic flooding at about the same rate," he said.
NFIP claims aren’t a perfect metric for who lives in flood zones, Sanders said. “In California, 99% of communities have access to NFIP policies, so many of the subscribers to the NFIP aren't necessarily even in flood zones,” he said. “They're taking advantage of it because they have a flood- or a mud-type hazard that they're trying to manage with insurance because they see it as good value.” Severe storms can cause dangerous mudslides in hilly areas of Los Angeles County, in addition to flooding.
As more flood models come into existence, it is increasingly important for communities to have “systematic, repeatable” methods for comparing their accuracy, the researchers write. “The urgent need for urban flood validation data highlights the importance of emerging efforts to systematically monitor urban flooding at hyper-local scales,” they say.
What does this mean for local leaders?
UC Irvine’s Sanders and First Street’s Porter agree that city leaders shouldn’t rely on just one set of data when making flood-risk management decisions.
Porter advises city officials to ask themselves what insights they can glean from the differences and similarities between flood-risk models. Questions Sanders suggests include “Has your flood-control district … looked at this data compared to some of their existing maps?” and “Do they have confidence that this is a reasonable approximation?”
But that may be a lot to ask of some city governments when “we suddenly have 10 or 15 models to work with,” Sebastian said. Sanders echoed that concern. “It takes a pretty on-the-ball climate specialist in government to be able to look at all these maps and think about what went into them and which one is most useful for the kinds of studies that they want to do,” he said.
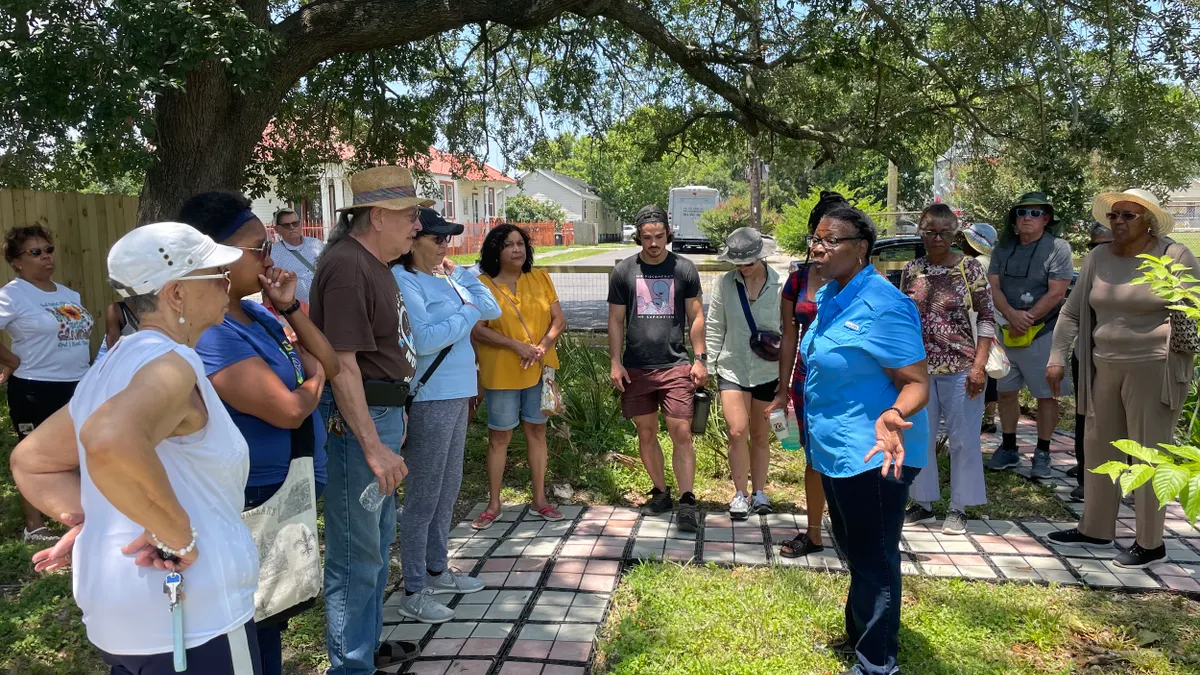
Cities should “locally ground truth” the data by asking community members whether flood-risk maps reflect their lived experience and which flood-prone areas are of the highest priority to them, UNC’s Sebastian said. “Community engagement, whether that’s in strategic planning or funding allocation ... is really critical in this moment, where we have a lot of information, but we're still figuring out how to use it well,” she said.
In their paper, the researchers also encourage communities to also take flood-mitigation steps that don’t necessarily require the use of flood hazard maps, such as restoring natural areas and requiring buildings to be constructed to higher standards after extreme events.


